Introduction
A leading company in the building materials and plumbing fixtures industry, with well-known brands and annual sales of approximately US$5.0 billion, serves customers worldwide. This company operates several manufacturing facilities globally, where porcelain—a crucial raw material—requires careful handling due to its fragility at high temperatures. Recognizing the need to minimize manufacturing waste as they expanded, the company partnered with Pluto7 to explore data-driven production methods
Business Challenge
The company faced a significant manufacturing challenge, with 8-10% of their products resulting in defects, leading to substantial financial losses. Initially, high kiln temperatures were suspected as the primary cause of the defects. Despite various efforts, the company struggled to identify and implement a successful solution.
Pluto7’s Data Science Approach
After analyzing 12 months of sample data, Pluto7 determined that the defects were not solely due to temperature but were significantly influenced by the quality of the raw materials used in Slip Preparation. Machine learning techniques enabled the identification of optimal temperature bands for the twenty-two zones within the kilns, along with a dynamic framework for setting these temperatures to reduce defects.
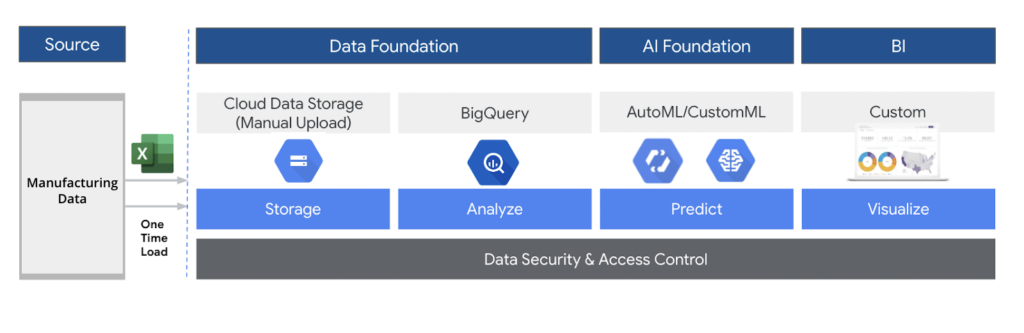
Creating a Centralized Data Foundation
Pluto7 helped establish a centralized data foundation to collect and store data related to the manufacturing process, including temperature and moisture levels. This foundation provided essential insights into the manufacturing operations and identified improvement opportunities.
We followed a comprehensive set of steps to ensure accurate analysis and optimal results.
- Exploratory Data Analysis: helps understand the data pattern and identify any trends or anomalies in the data.
- Pre-processing: involves removing duplicates, null values and cleansing the data to prepare it for analysis.
- Data Transformation: involves joining multiple tables and restructuring the data to create a unified view for analysis.
- Feature Engineering: involves creating new features and preparing the features for modeling by scaling, normalizing, or encoding them appropriately.
- Modeling: involves experimenting with different algorithms and selecting the best one that provides the highest accuracy and best performance.
- Hyperparameter Tuning: involves optimizing the model performance by fine-tuning the hyperparameters and selecting the best values for them.
- Validation: involves validating the outcomes of the model and ensuring that the model provides accurate and reliable results.
Exploring the Relationship between Temperature and Defects
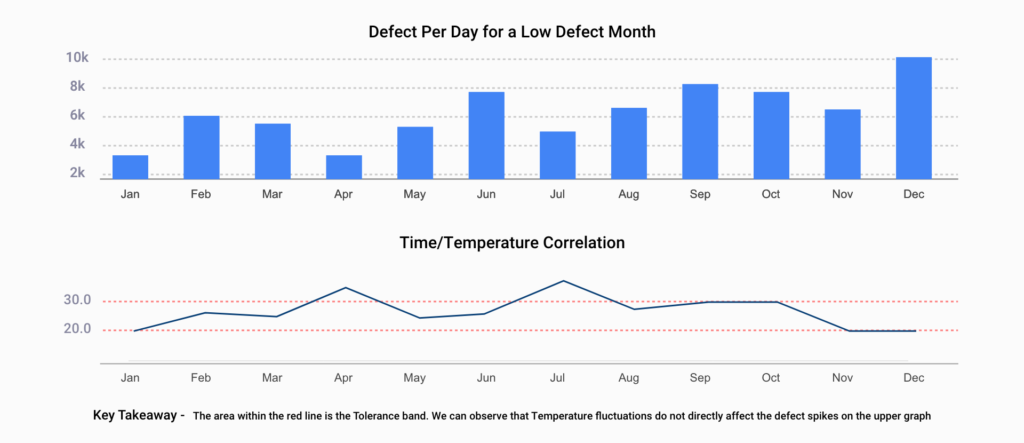
Experiment 1: Defects per day for a low-defect month
We conducted exploratory data analysis to uncover the relationship between temperature and defects. In one of our experiments, we focused on identifying defects per day for a low-defect month. Our findings revealed that temperature fluctuations do not necessarily correspond with defect spikes.
The area within the red line is the Tolerance band. We can observe that Temperature fluctuations do not directly affect the defect spikes on the upper graph
Experiment 2: Defects per day for a high-defect month
We analyzed a high-defect month with a focus on a single defect category, namely “crack on body.” Our observations revealed that although there were higher fluctuations in temperature compared to the low-defect month, there was no clear correlation between these fluctuations and demand spikes.
ML Models Experiments
Experiment 1: K-Means Clustering
We experimented with K-Means clustering to identify different clusters of temperature readings in the observed kiln zones, specifically focusing on low and high defect clusters. We found that the cluster combinations for high and low defects were identifiable and that the minimum and maximum temperatures for each cluster were close to the actual values. However, we also found that outliers had a significant influence on the results. As a result, we decided to try other machine learning algorithms to see if we could obtain more accurate results in predicting the correlation between temperature and defects.
Experiment 2: Gaussian Mixture Clustering
Through experimentation with Gaussian models, we discovered that Gaussian mixture clustering was effective in identifying the minimum and maximum temperature ranges that would result in fewer defects in our manufacturing process.
Unlike K-Means clustering, the Gaussian mixture results were not affected by temperature outliers, and the algorithm identified temperature ranges that were even closer to the current minimum and maximum.
In fact, the outcomes fell within the approved temperature ranges currently used by the company, demonstrating the algorithm’s effectiveness.
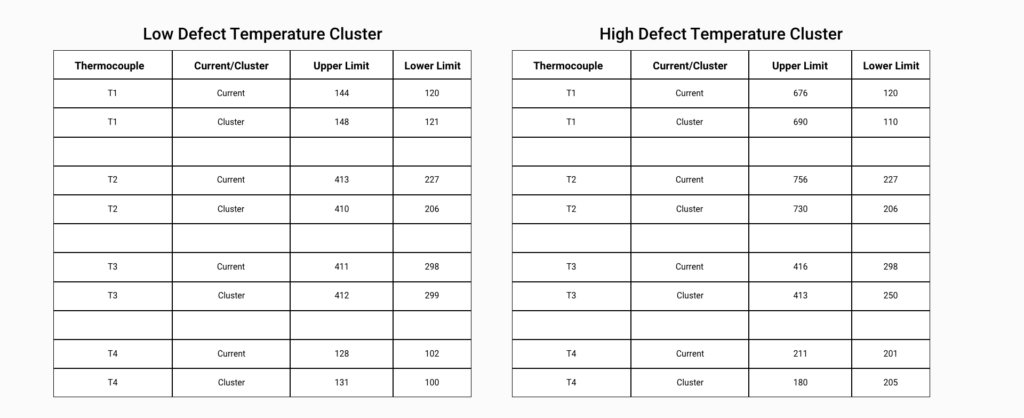
The comparison of the above two clusters clearly indicates that the temperature ranges for low defect clusters are narrower than those for high defect clusters. Additionally, the low defect cluster has minimum and maximum temperatures that are closer to the current temperature ranges being used.
Experimentation with Moisture Data
We conducted an experiment to determine if a combination of temperature and moisture data was causing defects in our manufacturing process. Using the ‘Bowl’ product, we filtered the existing kiln datasets to include only rows with no defect and those with the ‘Crack on body’ defect.
We then carried out a hypothesis testing to check for correlations between temperature, moisture, and defects for this dataset. Promising results were obtained, indicating a positive correlation between moisture data and defects.
To further explore this correlation, we employed various defect algorithms, including Logistic Regression, Random Forest, XGBoost, and CatBoost. The Random Forest algorithm provided balanced results, accurately predicting the formation of defects with 88% accuracy. These findings suggest that moisture data may be contributing to defects in our manufacturing process and provide a pathway for further improvements.
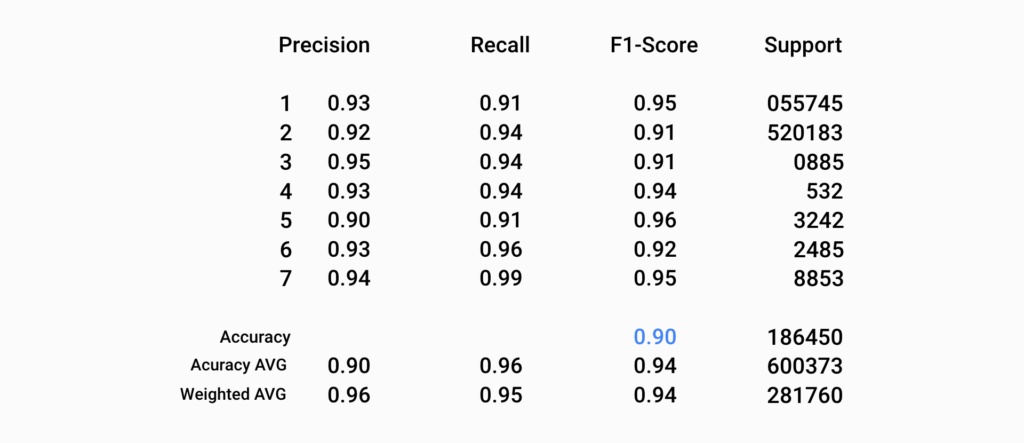
Random Forest Results showing a positive correlation with Moisture Data
Advanced Analytics with Machine Learning
With data centralization, we now had the capability to run advanced analytics and get answers to questions that would have otherwise taken days to compile and generate. Some of the insights generated through our data-driven approach are highlighted below:
What are the most common defect zones?
Through our analysis, we were able to identify six key zones that were contributing to the defects in our manufacturing process. This helped us narrow the search further, enabling us to take targeted corrective measures.
Which are the most prevalent defects?
With over 40 prevalent defects identified, we were able to pinpoint two key defects that were most commonly occurring in our manufacturing process. This allowed us to focus our efforts on minimizing the occurrence of these defects.
Which kiln has the optimum production-to-defect ratio?
After thorough data analysis, it became evident that one specific kiln, responsible for 40% of the company’s total production output, was also contributing to approximately 55% of the manufacturing defects. This disparity indicates a significant imbalance between production output and defect rates, underscoring the need for corrective measures to optimize efficiency and minimize defects in this particular kiln.
By identifying this kiln, we were able to prioritize corrective measures, ensuring that our production processes were optimized and defects were minimized.
Conclusion
By bringing together various datasets and analyzing them, we identified key areas of focus for further investigation. With this centralization in place, we can now conduct rapid experiments that were previously impossible and leverage advanced data science techniques to optimize manufacturing processes. Over the next few months, we will continue to analyze data, synthesize it, and build scalable data models on the Google Cloud Platform. By doing so, we believe this company will be able to unlock new insights, optimize its manufacturing processes, and drive business growth.
For more information
www.pluto7.com/success-stories