✨Accelerate Autonomous Supply Chain and Manufacturing with Google Cloud agentic platform, co-existing systems example SAP, Oracle, Salesforce and Cloud Marketplace!
Demand Sensing: The Key to Unlocking Deeper Customer Insights
What is Demand Sensing?
Demand sensing is a method of using real-time data and advanced analytics to understand and predict customer demand, enabling companies to optimize their supply chain and inventory management. It differs from traditional demand planning, which relies on historical sales data and assumes that future demand will follow the same patterns as in the past.
Demand sensing is designed to be more agile and responsive, incorporating up-to-date information on factors like changes in consumer behavior, weather patterns, and economic conditions.
In today's market, demand sensing is becoming increasingly important as companies face a variety of challenges that make traditional demand planning less effective. These challenges include:
Rapidly changing consumer preferences:Consumers today have access to more information and more choices than ever before, leading to constantly evolving preferences and buying patterns. Traditional demand planning may not be able to keep up with these shifts, leading to inaccurate forecasts and missed opportunities.
Increasing complexity of supply chains:Supply chains are becoming more global and interconnected, with more stakeholders and variables to manage. This complexity makes it more difficult to forecast demand using traditional methods accurately.
Market Disruptions:Market disruptions can have a significant impact on demand for products and services, and companies that are not able to respond quickly to these changes risk losing market share and revenue. Economic factors, such as changes in consumer income or shifts in global trade policies, can impact demand in unexpected ways. Social factors, such as changes in consumer preferences or the emergence of new technologies, can also have a significant impact on demand. Environmental factors, such as natural disasters or pandemics, can disrupt supply chains and lead to significant shifts in demand.
Traditional Demand Forecasting vs. Demand Sensing: A Comparison
In order to respond to market volatility and shifting consumer preferences, companies need to be able to adjust their production and inventory levels quickly and effectively. This requires access to real-time data and the ability to make rapid decisions based on that data. Traditional demand planning methods, which rely on historical data and statistical models, may not be able to provide the level of agility and responsiveness needed in today's market.
Demand sensing, on the other hand, is designed to provide real-time visibility into customer demand and enable companies to adjust their demand plans and inventory levels accordingly. By incorporating data from a variety of sources, including social media, weather patterns, and economic indicators, demand sensing can provide a more accurate and comprehensive picture of demand. This allows companies to make more informed decisions about production and inventory levels, as well as pricing and promotional strategies.
For example, consider the impact of the COVID-19 pandemic on consumer demand. As the pandemic swept across the globe, many traditional demand planning methods were unable to keep up with the rapid changes in consumer behavior. Demand for certain products, such as toilet paper and cleaning supplies, skyrocketed while demand for other products, such as travel and hospitality, plummeted.
Companies that were able to use demand sensing to quickly adjust their supply chains and inventory levels were better positioned to weather the storm and emerge from the pandemic with minimal damage.
Parameters
Traditional Demand Forecasting
Demand Sensing
Data used
Historical sales data
A wide variety of data such as real-time sales data, weather, economic data etc.
Forecasting techniques
Statistical forecasting models
Advanced analytics and machine learning
Short-term and Mid-term Forecast accuracy
Low
High
Responsiveness
Limited
High
Lead time
Long lead times for adjustments
Short lead times for adjustments
Integration with systems
Typically integrated with ERP systems
Can be integrated with a wide range of systems
Traditional demand forecasting misses out on external demand signals
Traditional demand forecasting methods rely on historical sales data to predict future demand. This data is typically collected from point-of-sale (POS) systems, which track sales at the individual store level. The data is then aggregated and analyzed using statistical forecasting models such as time-series analysis, moving averages, and exponential smoothing to identify patterns in the data and make predictions about future demand.
While historical sales data can provide valuable insights into past performance, it has limitations when it comes to predicting future demand. For example, historical sales data may not take into account changes in consumer preferences, economic conditions, or external factors such as weather patterns or supply chain disruptions. This can lead to inaccurate forecasts and missed opportunities for retailers to capitalize on changes in the market.
Demand sensing, on the other hand, leverages a much broader range of data sources to provide a more accurate and up-to-date picture of demand. In addition to historical sales data, demand sensing methods incorporate real-time sales data, weather data, economic data, social media trends, and other external factors. By analyzing this data using advanced analytics and machine learning techniques, demand sensing methods can provide more accurate and timely forecasts.
What are external demand signals?
External demand signals are indicators or factors beyond a company's control that can affect the demand for its products or services. Google's external datasets are a valuable resource for understanding such signals. These datasets provide insights into various factors that influence demand, such as economic trends, market conditions, and consumer behavior.
For example, Google Trends can reveal how often specific search terms are being used, which can provide an indication of consumer interest in certain products or services.
Google Adtech can provide insights into how users are interacting with a company's website, which can help identify areas where demand may be increasing or decreasing.
Google Consumer Surveys can provide valuable information on consumer preferences and behavior.
Example - Capturing external demand signals using Google’s Weather Data
For example, let's consider a retail scenario where a clothing store is trying to forecast demand for winter coats. Traditional demand forecasting methods would rely on historical sales data for winter coats from previous years to make predictions about future demand. However, this approach may not take into account external factors such as weather patterns. If there is an unseasonably warm winter, demand for winter coats may be lower than expected, resulting in excess inventory and missed sales opportunities.
Case Study: How A Retail Brand Leverages External Datasets to Improve Forecast Accuracy
One of our customers, Tacori, combines CRM, SCM, and external data to create dynamic pricing strategies, personalize offerings, create targeted ad campaigns, and reduce inventory costs.
By blending data from various sources, Tacori is able to create dynamic pricing strategies, personalized offerings, targeted ad campaigns, and reduce inventory costs. We help Tacori integrate data from various sources, such as ERP, CRM, and sales, on a common data platform and then blend their internal data with external datasets. We then use machine learning models to improve the data quality further, leading to more accurate demand signals.
The key takeaway is that by monitoring and analyzing data from multiple aspects of the business, companies can optimize every layer of their supply chain, leading to improved operational efficiency and better decision-making.
The importance of utilizing external data cannot be overstated. By incorporating signals from external sources, companies can gain insights into market trends, customer behavior, and competitor activity. This information can then be used to create more effective strategies for forecasting demand, managing inventory, and setting prices.
Overcoming the Limitations of Statistical Demand Forecasting with Advanced Analytics and Machine Learning
Traditional statistical demand forecasting has been a widely-used method for predicting future demand. However, it has several limitations that can hinder its effectiveness in modern business environments. These limitations include an over-reliance on historical data, limited ability to handle real-time data, and difficulty in capturing complex, nonlinear relationships between variables.
Dependency on historical data: Traditional demand forecasting methods rely heavily on historical data, assuming that past trends and patterns will continue into the future. However, in today’s fast-paced market, historical data may not always be a reliable predictor of future demand. For example, sudden changes in consumer preferences, market disruptions, and unexpected events such as natural disasters can disrupt the historical patterns that forecasting models rely on.
Limited ability to handle real-time data: Traditional forecasting methods typically rely on periodic updates of data, such as monthly or quarterly data. However, in today’s market, real-time data is becoming increasingly important. This is because market disruptions can occur at any time, and traditional forecasting models may not be able to capture these changes in real-time. This can lead to missed opportunities or inventory shortages.
Difficulty in capturing complex, nonlinear relationships between variables: Traditional forecasting methods are often limited in their ability to capture complex, nonlinear relationships between variables that can impact demand. For example, consumer behavior is influenced by a wide range of factors, including economic conditions, social trends, and environmental factors. These factors can interact with each other in complex ways that are difficult to capture using traditional statistical models.
Demand sensing overcomes these limitations using advanced analytics and machine learning techniques to analyze real-time data from multiple sources. By combining internal data sources such as sales data, inventory levels, and supply chain data with external data sources such as weather data, social media, and online search data, demand sensing models can generate more accurate and up-to-date demand forecasts.
Demand sensing models can also capture complex, nonlinear relationships between variables using machine learning algorithms such as neural networks and decision trees. These models can learn from past patterns and use that knowledge to make predictions about future demand. Additionally, modern data platforms, such as those that integrate with spreadsheets, can make it easy to apply advanced analytics techniques to large and complex datasets while maintaining the familiarity and convenience of spreadsheet applications.
Maximizing Short-term & Mid-term Forecast Accuracy: A Comparative Analysis of Traditional Demand Forecasting and Demand Sensing
Short-term forecasts typically cover a time horizon of up to 3 months, while mid-term forecasts typically cover a time horizon of 3 to 12 months. Short-term forecasts are critical for day-to-day operational decisions, such as production planning and inventory management, while mid-term forecasts are used for longer-term planning, such as capacity expansion and resource allocation.
Traditional demand forecasting methods rely heavily on historical data, typically using statistical techniques such as time series analysis or regression analysis to identify patterns and trends in the data. These methods assume that past demand patterns will continue into the future, and they are often unable to capture sudden changes in demand due to external factors such as market disruptions or shifts in consumer behavior.
As a result, traditional demand forecasting methods may struggle to generate accurate short-term and mid-term forecasts, particularly in volatile or rapidly changing markets.
In contrast, demand sensing leverages advanced analytics and machine learning algorithms to generate short-term and mid-term forecasts based on real-time data from a wide range of sources, including point-of-sale data, social media activity, weather forecasts, and economic indicators. By using real-time data, demand sensing is better able to capture sudden changes in demand patterns and adjust forecasts accordingly.
For example, imagine a retailer using traditional demand forecasting methods to predict demand for a specific product line. The retailer relies on historical sales data from the past year, as well as data on promotions, seasonality, and other factors that may impact demand. However, in the current year, there is a sudden shift in consumer behavior due to a new trend or market disruption, leading to a significant increase or decrease in demand for the product line. Traditional demand forecasting methods may struggle to capture this sudden change and generate inaccurate forecasts, leading to stockouts or overstocking.
How Does Demand Sensing Work?
Now that we know what demand sensing is, let’s explore how it works, the benefits it provides to companies, and some real-world examples of its implementation.
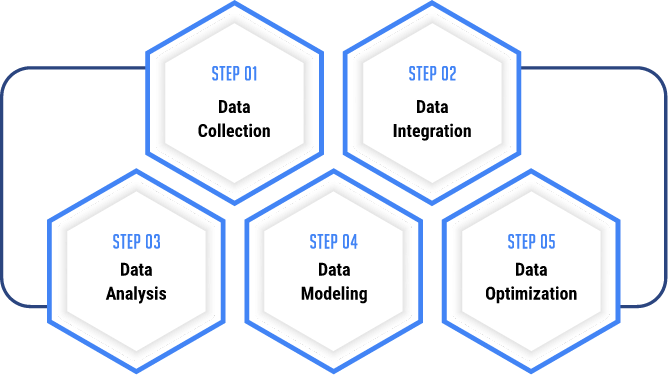
Step 1: Data Collection
The first step in demand sensing is data collection. Companies must collect a variety of data related to the product or service, such as sales history, inventory levels, and customer behavior. This data can come from a variety of sources, including point-of-sale systems, online sales platforms, and customer surveys. Data from external sources such as social media trends, weather patterns, and economic indicators can also be included to provide a more comprehensive picture of consumer demand.
How a Data Platform Can Help Gather and Integrate Data
To collect and integrate data from various sources efficiently, companies often use data platforms that provide a centralized repository for all relevant data. These platforms can aggregate data from multiple sources, such as point-of-sale systems, online sales platforms, customer surveys, and external sources like social media and weather data.
Data platforms can also perform data cleansing and transformation to ensure consistency and accuracy in the analysis. Additionally, some data platforms have built-in machine-learning tools that can automatically analyze data and identify patterns in consumer behavior.
For example, Pluto7’s Data Platform is leveraged by SAP users, especially those using SAP Integrated Business Planning (IBP), to gain external insights for demand sensing. The platform’s data blending capabilities enable companies to integrate data from multiple sources, including external sources such as social media and weather data, into their SAP IBP system. This integration allows SAP IBP users to gain valuable insights into external demand signals, such as market trends and competitor behavior, which can be used to make more accurate predictions of future demand.
Step 2: Data Integration
Once the data is collected, it must be integrated into a single database or platform to enable analysis. This step involves the extraction, transformation, and loading (ETL) of the data, which can be a time-consuming process. The process of data integration typically involves three main components: extraction, transformation, and loading (ETL).
Extraction involves pulling data from various sources, such as point-of-sale systems, online sales platforms, customer surveys, and external sources like social media and weather data. This can be a complex process, as data may be stored in different formats or require different extraction methods.
Transformation involves cleaning and standardizing the data to ensure consistency and accuracy in the analysis. This step may involve removing duplicate entries, correcting errors, and standardizing data formats.
Loading involves moving the transformed data into a single database or platform. This can be done through a variety of methods, such as batch processing or real-time data streaming.
Challenges in Integrating External Datasets
Integrating external datasets into a demand sensing platform can be challenging due to a variety of factors. For example, external datasets may be stored in different formats or require specialized extraction methods. Additionally, external datasets may contain missing or incomplete data or be subject to data privacy and security concerns.
To overcome these challenges, companies can use a variety of techniques and technologies, such as
Data Wrangling: This involves preparing data for analysis by cleaning and transforming it into a standardized format. It can be done manually or through automated data-wrangling tools.
API Integration: Some external datasets may offer application programming interfaces (APIs) that enable companies to access and integrate the data directly into their demand sensing platform.
Data Governance: Establishing data governance policies and procedures can help ensure the quality and security of external datasets.
Data Integration Platforms: Using a data integration platform can help streamline the ETL process and provide a centralized repository for all relevant data.
Real-world Example: Ulta Beauty
Ulta Beauty wanted to predict the quantity that will be delivered by a supplier when an order is placed. To help them achieve this, we used the best-of-breed products of Google Cloud Platform tailored to Ulta Beauty’s specific requirements. The data was collected and uploaded to a Cloud Storage bucket, then cleaned and transformed using the Vertex AI notebooks.
Multiple iterations were performed on the transformed data to ensure accuracy. BigQuery ML was also used to quickly develop a baseline model on the pre-processed data. Using Pluto7’s data platform, an accurate model was built to predict the delay in delivery with an accuracy of 72%, and another model was built to predict the received quantity with an accuracy of 88%.
With the data integrated, companies can use various statistical and machine-learning techniques to analyze the data and identify patterns in consumer demand. For example, they may use regression analysis to understand the relationship between sales and different variables such as price, seasonality, and marketing promotions.
Machine learning algorithms such as neural networks and decision trees can be used to capture complex, nonlinear relationships between variables. These algorithms can identify patterns in the data that may be missed by traditional statistical methods and can make more accurate predictions of future demand.
Step 4: Data Modeling
Based on the analysis, companies can develop models to predict future demand for the product or service. These models may incorporate real-time data, such as changes in inventory levels, weather patterns, or social media trends. The models can also be updated on a regular basis to incorporate new data and improve their accuracy.
Step 5: Data Optimization
Companies can then use the demand sensing models to optimize their supply chain and production processes, ensuring that they can meet demand while minimizing excess inventory or stockouts. For example, if the demand for a particular product is predicted to increase, the company can adjust its production schedule to increase output and ensure that the product is available in sufficient quantities.
Benefits of Demand Sensing in Supply Chain Optimization
Demand sensing is a powerful tool that can provide companies with a variety of benefits, including improved accuracy in demand forecasting, enhanced customer satisfaction, reduced inventory costs, and improved agility. By using real-time data and advanced analytical techniques, companies can make more accurate predictions of future demand, which can be crucial in optimizing supply chain operations and meeting customer needs.
Short-term and Mid-term Demand Accuracy:
Demand sensing can improve short-term and mid-term demand accuracy by providing real-time insights into consumer behavior. This can help companies quickly adjust production schedules and inventory levels to meet changing demand. By accurately forecasting demand, companies can avoid stockouts and minimize excess inventory, which can result in significant cost savings.
Last Mile Delivery and Stockouts:
Demand sensing can also help companies avoid stockouts and optimize last-mile delivery. By predicting demand for specific products, companies can ensure that they have the necessary inventory on hand to meet customer demand. In addition, by using real-time data on traffic, weather, and other external factors, companies can optimize delivery routes and schedules to ensure timely delivery.
Events like Halloween or Black Friday Sale:
Demand sensing can be particularly useful for events such as Halloween or Black Friday sales. By analyzing historical sales data and external demand signals, companies can accurately predict demand for specific products and adjust inventory levels accordingly. This can help companies avoid stockouts during these high-demand periods and ensure that customers have access to the products they want.
E-commerce Store Benefits:
Demand sensing can also be incorporated into e-commerce stores to improve pricing techniques and ad optimization. By analyzing real-time data on consumer behavior, companies can optimize pricing strategies and targeted advertising to increase sales and customer satisfaction.
Impact on Sales:
Demand sensing can provide granular insights into sales activities, engagement, and delivery status. By monitoring late deliveries and comparing pending deliveries with current stock, companies can optimize inventory levels and reduce stockouts. Additionally, by gaining insights into accounts receivable and sales outstanding values, companies can improve cash flow and minimize financial risk.
The Role of Machine Learning in Demand Sensing
Traditional demand planning methods rely on statistical models and historical sales data, which can be unreliable due to rapidly changing market conditions and consumer preferences. Machine learning-led demand planning offers a more accurate and efficient approach by analyzing a broader range of data points and identifying patterns that would be difficult for humans to detect.
What is machine learning?
Before the advent of machine learning, statistical modeling was the primary method for analyzing data and making predictions. Statistical models are based on mathematical algorithms that analyze data to identify patterns and relationships between variables. This approach has been used for decades in a wide range of fields, including finance, economics, and social sciences.
However, statistical modeling has some limitations, especially in rapidly changing environments where new data is constantly being generated. Machine learning provides a more adaptive and flexible approach to data analysis and prediction, and it can identify patterns and relationships that would be difficult for humans to detect.
Machine learning algorithms are designed to identify relationships and dependencies in the data and to make predictions based on these insights. As the algorithm is trained on more data, it becomes more accurate and can make better predictions.
What kind of data is required to be fed into machine learning models for accurate demand predictions?
To achieve accurate demand sensing predictions, machine learning models require a diverse set of data inputs. Some of the most relevant data sources that can be used to train machine learnings models for accurate demand predictions include:
Historical sales data
Demand data
External data sources (such as Google adtech data, Google trends data, weather data, economic data, and social media data)
Marketing data (such as data on marketing campaigns, promotions, and pricing strategies)
Supplier data (such as lead times and delivery schedules)
Demographic data (such as age, gender, and location of customers)
Inventory data (such as current inventory levels and stockouts)
Seasonality data (such as data on seasonal patterns in consumer behavior and product demand)
Product attribute data (such as color, size, and material)
Pricing data (such as competitor pricing data and pricing elasticity)
Point-of-sale data (such as data on transactions and customer behavior)
Product lifecycle data (such as data on new product launches and product discontinuations)
Customer segmentation data (such as data on customer behavior and preferences)
Supply chain data (such as data on lead times, transportation, and production schedules)
Quality data (such as data on defects and returns)
The data sources should be integrated to provide a comprehensive view of the market and consumer behavior. The planner should ask questions that will help direct the data inputs and inform the forecast outputs.
The following are some of the questions the planner could ask:
What are the key factors that impact demand for our products?
How does the external environment, such as weather or economic conditions, affect consumer behavior?
What are the current trends and patterns in consumer behavior?
How can we use marketing data to influence consumer behavior and drive sales?
How can we leverage social media data to gain insights into consumer sentiment and behavior?
For example, consider a company that wants to train an ML model to reduce inventory carry-over costs. In this scenario, the planner should focus on data inputs that can help reduce inventory carry-over.
The planner could ask questions such as:
What are the historical sales trends for each individual product in our portfolio, and how can we use this information to forecast future demand accurately?
How can we leverage adtech data and Google Trends data to gain insights into consumer behavior and improve our marketing campaigns?
How does weather impact product demand on a regional level, and how can we adjust our inventory levels accordingly by factoring in regional weather patterns?
What are the current economic conditions in our key markets, and how do they impact consumer behavior and product demand? How can we use this information to forecast future demand?
How can we work with our suppliers to improve their forecast accuracy and reduce lead times?
How can we leverage data from dark stores to improve our demand sensing and planning accuracy?
What is the impact of seasonality on demand for each of our products, and how can we adjust our inventory levels accordingly to ensure optimal stock levels?
How can we incorporate data from social media and other digital sources to gain insights into consumer behavior and improve our demand sensing and planning accuracy?
Sales data is often a contentious issue in demand planning, with some planners arguing against its use as an input for forecasting. However, sales data is a critical input for demand planning, as it provides insight into actual customer behavior. By analyzing sales data, planners can identify trends and patterns in customer behavior that can be used to inform future forecasts. Historical sales data can also provide insights into long-term trends and patterns, allowing planners to make data-driven decisions about future product development and marketing strategies.
However, sales data should not be the only data source for forecasting. Rather, it should be one of many inputs planners use to gain a comprehensive view of consumer behavior and product demand.
How Machine Learning Enables Precise Demand Prediction
The accuracy of the demand prediction generated by the machine learning model would depend on several factors, such as the quality and quantity of data used to train the model and the complexity of the model itself. However, studies have shown that machine learning can improve the accuracy of demand predictions by up to 20% over traditional forecasting methods.
To understand the impact of a 20% bump in accuracy, let’s consider the following example.
Suppose a company has a monthly demand for a particular product of 10,000 units, with a cost per unit of $10. If the company’s current forecasting method has an error rate of +/- 10%, this means that the actual demand for the product could be anywhere between 9,000 and 11,000 units.
Now, suppose the company implements a machine learning model that improves the accuracy of demand predictions by 2%. This means that the error rate of the new model would be +/- 0.2% or approximately +/- 20 units. The actual demand for the product could be anywhere between 9,980 and 10,020 units.
Assuming the company carries a one-month supply of inventory, the inventory cost for the product would be $100,000 (10,000 units x $10 per unit). If the company overestimates demand by 100 units, it will end up with excess inventory worth $1,000 (100 units x $10 per unit). Conversely, if the company underestimates demand by 100 units, it will experience stockouts, which can lead to lost sales, reduced customer satisfaction, and increased production and shipping costs.
Now, let’s consider the same scenario using the machine learning model. If the machine learning model accurately predicts demand for the product, the company will have the right amount of inventory on hand, eliminating the need for excess inventory or experiencing stockouts. This can result in cost savings of up to $1,000 per month, depending on the magnitude of the error in the original forecast.
While $1,000 per month may not seem like a significant amount, it can add up over time. Over the course of a year, the cost savings could amount to $12,000. For a large company with multiple products, the cost savings could be even greater.
The key thing to remember here is that even a small improvement in demand prediction accuracy can translate into significant cost savings for a company with a large and complex supply chain.
By blending Google adtech data with sales data and other external data sources, the company can create a more comprehensive demand prediction model that takes into account a wider range of variables. If the model accurately predicts demand for the product, the company will have the right amount of inventory on hand, eliminating the need for excess inventory or experiencing stockouts. This can result in even greater cost savings than using a traditional sales data-based model alone.
Demand Sensing with SAP IBP
SAP Integrated Business Planning (IBP) is a cloud-based supply chain management software suite that provides companies with real-time insights into demand and supply planning. The software uses a variety of statistical models and machine learning algorithms to forecast demand, optimize inventory levels, and streamline the supply chain. However, one of the limitations of SAP IBP is its limited ability to access external datasets from sources such as Google, which can provide valuable insights into customer behavior and preferences.
To overcome this limitation, companies can use a data platform to bridge the gap between SAP IBP and external datasets. A data platform can provide a centralized location for collecting and analyzing data from multiple sources, including Google adtech data, social media, and other external datasets.
One example of a data platform that can seamless connect the dots between internal and external datasets is Pluto7’s Cortex-enabled data platform. The platform uses machine learning and AI algorithms to analyze data from multiple sources, providing companies with insights into customer behavior and preferences. The platform can be integrated with SAP IBP, providing a seamless integration between the two tools.
From Data Integration to AI Modeling: 6 Steps to Successful Demand Sensing on SAP IBP
Once the data platform is set up, the next step is to integrate the various data sets into one centralized platform.Integrating Google’s external datasets into SAP Integrated Business Planning (IBP) can be a complex process, but with due diligence and sufficient knowledge of both the SAP and Google Cloud environment, it can be done easily.
Step 1: Collecting Internal & External Data
Internal data types that can be collected from SAP ERP systems include production schedules, procurement, logistics, historical sales data, inventory levels, and customer data such as demographics and purchasing behavior. External data would include Google Trends, weather data providers, and ad tech data sources.
It’s not necessary to transfer all your SAP data to Google Cloud, as doing so can be costly and time-consuming. Instead, it’s important to identify the specific data that you need as input to generate your desired output, and only transfer that data to Google Cloud. This requires a clear understanding of the business objectives and the data requirements for achieving those objectives.
For example, if the goal is to improve demand forecasting accuracy, the necessary data might include historical sales data, customer demographics, and external factors such as weather and trends. By carefully selecting and transferring only the necessary data, companies can avoid unnecessary costs and ensure that their data remains organized and easy to manage.
Step 2: Data Storage
After the data is collected from various sources, including SAP ERP systems and external sources such as Google Trends, it needs to be stored and organized so that it can be analyzed and blended effectively. This is where tools like Google BigQuery come in.
Google BigQuery is a cloud-based data warehouse that allows companies to store and analyze large, complex datasets. It can store and manage large amounts of data from different sources, including SAP ERP systems and external sources, such as Google Trends. The data can be stored in tables, which are organized based on their schema. A data integration tool can be used here to transfer data from SAP systems into BigQuery on a regular basis.
Step 3: Data Transformation
Once the data is transferred into BigQuery, it can be transformed into a format that can be easily blended with external data sources. This transformation might include cleaning the data, standardizing data formats, and creating common data fields that can be used to blend the data.
Step 4: Data Blending
With the data from SAP ERP systems and external data sources in BigQuery, the next step is to blend the data sources. This can be done using SQL queries that join the tables from the different data sources on common fields. For example, customer data from SAP ERP systems can be joined with Google Trends data using a common field such as product or customer IDs.
The process of blending the data sources involves identifying the relevant common fields, selecting the tables that contain the data, and specifying how the tables should be joined. This can be done through BigQuery’s graphical user interface or through SQL queries, depending on the user’s preference and expertise.
Automation in data blending and why it’s important
Automation is key in data blending as it saves time, reduces errors, and eliminates the need for manual labor, which can be costly, especially when highly skilled data scientists are involved. By using a data platform such as the one offered by Pluto7, the entire process of blending internal and external data sources can be automated, from data collection to data transformation and integration.
The platform allows for the automatic transfer and transformation of data between different systems and data sources, reducing the risk of errors and increasing the speed at which insights can be gained.
For example, a data integration platform could be used to automatically extract data from SAP ERP systems and external data sources, transform the data into a common format, and load it into BigQuery for blending and analysis. This can be done on a regular schedule, ensuring that the blended data is always up-to-date and available for analysis.
Real-world Case Study: Automating Data Integrations for Faster Sales and Customer Insights
California Design Den, a retail company, leveraged Google BigQuery, Google Cloud Storage, and Google Cloud Vision to reduce inventory carryovers by over 50% and improve the accuracy of demand planning quarter over quarter. By automating the data integration and transformation process, California Design Den is able to generate faster insights into product sales and customer behavior, allowing it to better determine which styles to manufacture and sell in the future.
Once the data is integrated, AI modeling can be applied to identify patterns and insights that can be used to inform future demand predictions. This can be done using tools such as TensorFlow, AutoML, or other AI frameworks available on Google Cloud. Once the AI models are trained, they can be used to make predictions on new data.
If a customer is on a multi-cloud environment, it may impact the AI models used for demand predictions. The reason for this is that different cloud providers may have different data management and integration tools and techniques, which may affect the accuracy and consistency of the data being used for AI modeling.
One solution for this challenge is to use a data platform that can connect to multiple cloud environments and integrate the data into a single location. This allows for easier data blending and AI modeling across multiple cloud sources, providing a more comprehensive view of customer behavior and preferences.
Pluto7’s Cortex-enabled data platform, for example, is designed to integrate with multiple cloud environments, including Google Cloud, Amazon Web Services, and Microsoft Azure, to provide a unified data source for analysis and AI modeling.
Step 6: User Interface
After the AI modeling is complete, the user interface can be designed to enable users to access and analyze the data. This can be done using tools such as Data Studio, a web-based data visualization tool, or other BI platforms available on Google Cloud.
A custom user interface can also be developed using tools such as Looker or Tableau, allowing for a more tailored and personalized experience for the end-users. The custom interface can be designed to display specific insights and metrics that are relevant to the user’s role and responsibilities.
For example, a supply chain manager may require different insights and metrics compared to a marketing manager. The interface can also be designed to provide real-time access to data and insights, allowing for quick decision-making and responsiveness to market changes.
Examples of Demand Sensing on SAP IBP
With the ability to blend SAP data with external data sources, businesses can gain a deeper understanding of customer behavior and demand trends. This allows for more accurate forecasting and better inventory management, helping businesses to optimize their operations and reduce costs.
Pluto7’s data platform enables businesses to blend internal SAP and ERP data with external data sources to gain demand-sensing insights. These insights are made available to end users via visualizations through Looker or their preferred BI tool.
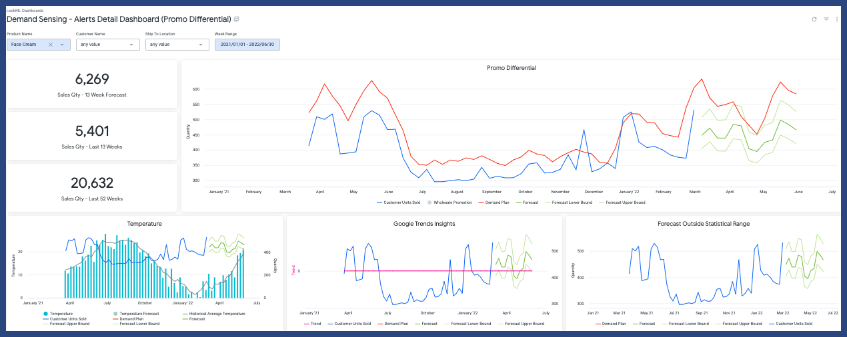
Demand planning insights:
For example, the platform offers a Promo Differentials dashboard that compares actual vs. forecasted sales, leveraging a range of external data sources, including Google Trends and Weather data, as well as Google Ad tech data. By incorporating these external signals, the dashboard can highlight latent demand that may be invisible to a customer’s existing demand planning tool.
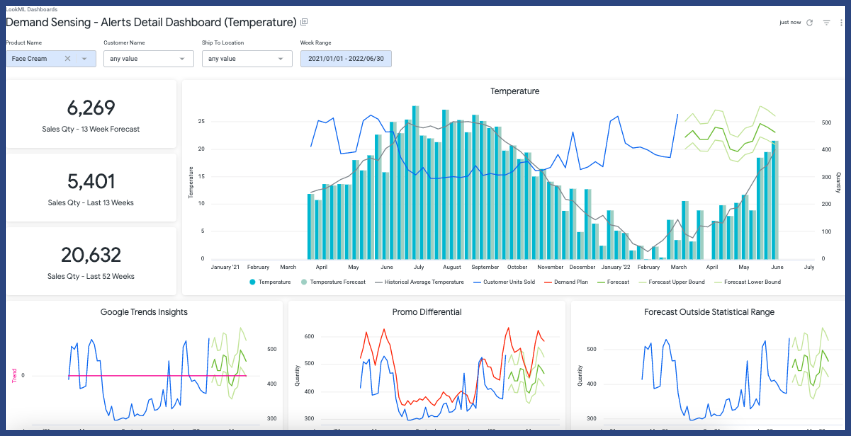
Here’s another example that illustrates the importance of external demand signals.
This dashboard leverages Google’s weather data to provide insights on sales quantity within a specific timeframe, categorized by ship-to location, product name, and customer based on temperature.
Users can apply various filters, such as location, customer, product, and date range, to customize the dashboard and display only relevant information. This allows businesses to gain a deeper understanding of the impact of weather on their sales and make more informed demand-planning decisions.
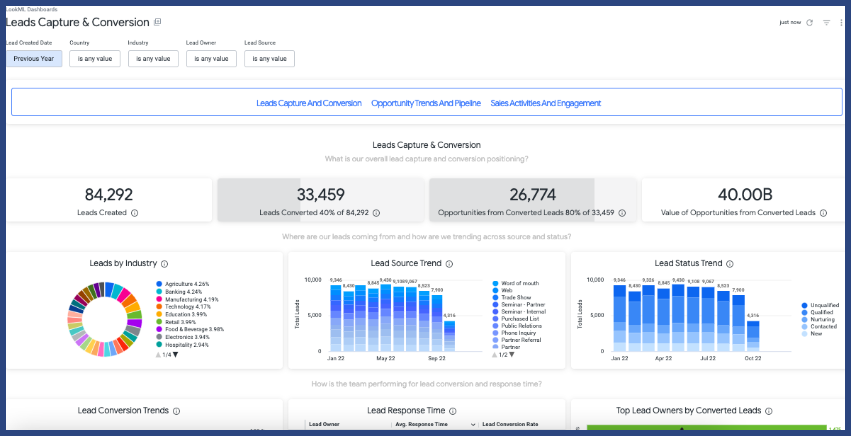
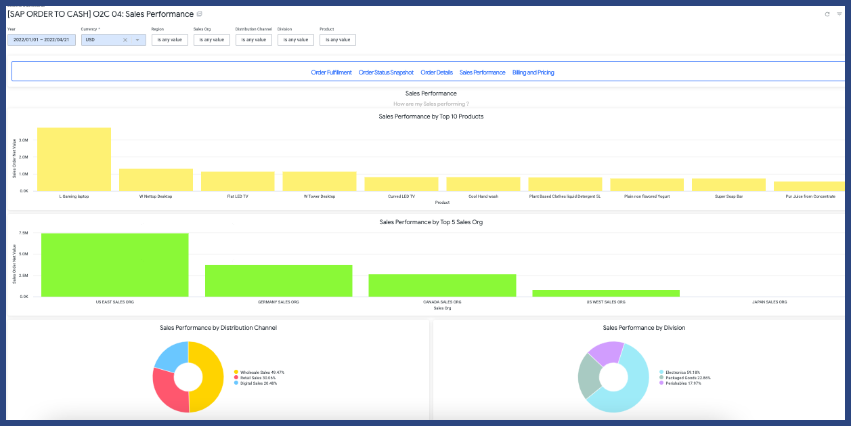
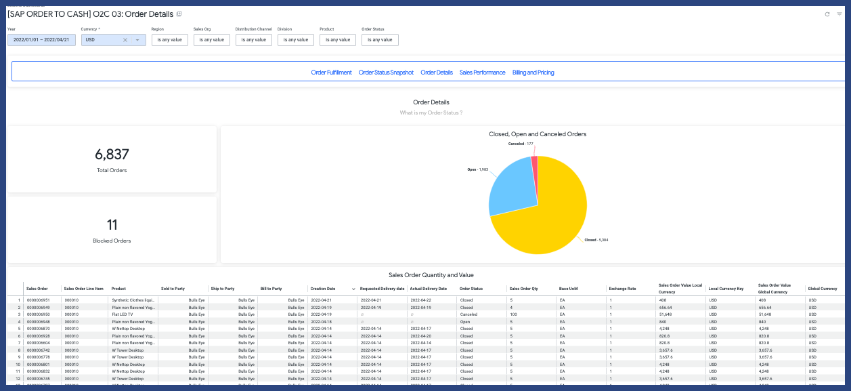
With Pluto7’s data platform, businesses can bring their Salesforce data to BigQuery through Google Cloud Cortex to run advanced analytics and develop machine learning models. This enables businesses to gain real-time insights into sales performance and identify emerging opportunities in the market.
For example, a business may be running multiple marketing campaigns across different channels, such as social media, email marketing, and paid search. By analyzing the leads generated from each of these campaigns, they can identify which channels are performing the best and allocate resources accordingly.
Additionally, by understanding the current status of each lead and how quickly they are converting to opportunities, businesses can optimize their sales process and improve conversion rates.
Businesses can also leverage the data platform to get trend analyses of sales performance by critical drivers such as product, brand, category, and more. They can track the status of closed, open, canceled, and returned orders, as well as monitor On Time In Full (OTIF) metrics and sales performance by region and product.
The platform’s flexibility also allows users to create custom queries and generate reports that their team can easily consume. By bringing Salesforce data into BigQuery, Pluto7’s data platform provides additional sales insights that can help businesses optimize their sales process and improve their bottom line.
Maintaining the data movement process from SAP ERP systems to BigQuery for demand sensing is a critical aspect of a successful implementation. To ensure that the data is properly managed and maintained, follow these best practices.
1. Develop a clear plan for data movement
Before beginning the data movement process, it is important to have a clear plan that outlines what data will be moved, how it will be transformed, and how it will be loaded into BigQuery. This plan should be reviewed and approved by all stakeholders to ensure alignment and minimize the risk of errors or omissions.
2. Use a reliable data integration platform
To ensure reliable and efficient data movement, it is recommended to use a reliable data integration tool that supports integration with both SAP ERP systems and Google Cloud. This will simplify the data movement process and reduce the risk of errors.
3. Establish data quality standards
Clearly define data requirements, including the types of data needed, the frequency of data updates, and the sources of data at the onset of the transformation journey. Data cleansing and validation processes should be implemented to ensure that data is properly formatted, standardized, and validated before it is loaded into BigQuery
4. Monitor data movement
Regular monitoring of the data movement process is essential to ensure that data is being transferred correctly and efficiently. This can be done by setting up alerts and notifications for any issues or errors that may arise.
5. Set up data governance rules
Establishing clear data governance policies and procedures can help ensure that data is properly managed and protected throughout the data movement process. This includes establishing roles and responsibilities for data management, as well as establishing processes for data access, security, and privacy.
6. Test, Optimize, Repeat
It’s important to regularly test and optimize the data movement process to ensure that it is running as efficiently as possible. Conduct regular performance tests to improve the speed of data transfer, the quality of the data being transferred, and the accuracy of the transfer.
Based on the results of performance testing, you can make modifications to optimize the data transfer process itself, such as adjusting batch sizes, changing transfer protocols, or implementing data compression. Additionally, modifications can be made to data validation rules to improve efficiency and reduce errors, or changes can be made to data cleansing processes to ensure that data is properly formatted and standardized.
7. Stay up-to-date on SAP and BigQuery Updates
SAP and Google Cloud regularly release updates and new features for their respective platforms. Staying up-to-date on these updates can help ensure that the data movement process is running smoothly and taking advantage of the latest features and capabilities.
For example, SAP has released a new feature called Datasphere that connects to external data sources, such as Google Cloud’s BigQuery, and brings that data into SAP systems for analysis.
With Pluto7’s Cortex-enabled data platform, the data movement process from SAP ERP systems to Google BigQuery for demand sensing is streamlined and automated. The platform offers pre-built connectors and integrations that enable seamless data extraction, transformation, and loading into BigQuery, eliminating the need for manual processes and reducing the risk of errors.
Additionally, the platform provides advanced security and monitoring capabilities to ensure the integrity and confidentiality of the data being transferred.
Conclusion
Throughout this exploration of the various concepts within demand sensing, we have learned about the differences between demand forecasting and demand sensing, as well as various demand sensing techniques such as statistical modeling, machine learning, and data blending.
When it comes to SAP, data movement to BigQuery can be challenging and requires careful planning and execution. Implementing an effective demand sensing system on SAP IBP requires understanding the data sources, aligning the team structure, and embracing the best practices of demand sensing.
We have also discussed the importance of data management, data collection, and integration when implementing an automated demand sensing process that regularly feeds in external insights into your planning system. It is critical to have a clear understanding of the data sources and how to blend them effectively, as well as the right team in place to manage the system and interpret the insights generated.
As seen through real-world examples, implementing demand sensing has the potential to drive significant business outcomes across a range of industries and functions. By accurately predicting demand and adjusting supply chain operations accordingly, businesses can reduce inventory costs, improve customer satisfaction, and increase revenue.
By leveraging tools like Google Cloud and partnering with experts like Pluto7, organizations can streamline the demand sensing process, reduce costs, and gain a competitive advantage in their industry.